data-analytics-portfolio
⏮️ Back to Portfolio Home; ⬅️ Previous Project; ➡️ Next Project
Personal Finance Analysis
Project Overview
This project presents an interactive Personal Finance Analysis Dashboard built in Google Sheets to analyze personal transactions and visualize spending patterns. It demonstrates skills in data cleaning, aggregation, pivot tables, chart design, and dashboard storytelling, while simulating how individuals can gain insights into their financial habits.
With these insights, individuals can:
- Identify overspending habits
- Track spending volatility by category and period
- Plan smarter budgets and long-term financial goals
Dashboard
Interactive Google Sheets:
View the live Google Sheet dashboard here:
View-only Dashboard in Google Sheets
Make a copy to interact with dropdown
Features:
- Total Expenses, Total Transactions, Average Transaction Value (ATV)
- Expense aggregation by quarter, year, month, and week to observe spending patterns
- Percentage Volatility for each category (Coefficient of Variation)
- Interactive filters for Aggregation by Time Period
- Conditionally formatted tables to highlight large or unusual expenses
Data Preparation
A cleaned and transformed dataset was created from raw personal transactions.
- Standardized categories:
- Food & Dining (Restaurant, Market, Coffee)
- Transport & Travel
- Housing & Utilities
- Shopping & Personal
- Health
- Learning
- Leisure & Lifestyle
- Reimbursable
-
Miscellaneous
- Derived fields created:
Month,Quarter,Year,Day,WeekdayAverage Transaction Value (ATV)Percentage Variationfor category volatility
Key Metrics Tracked
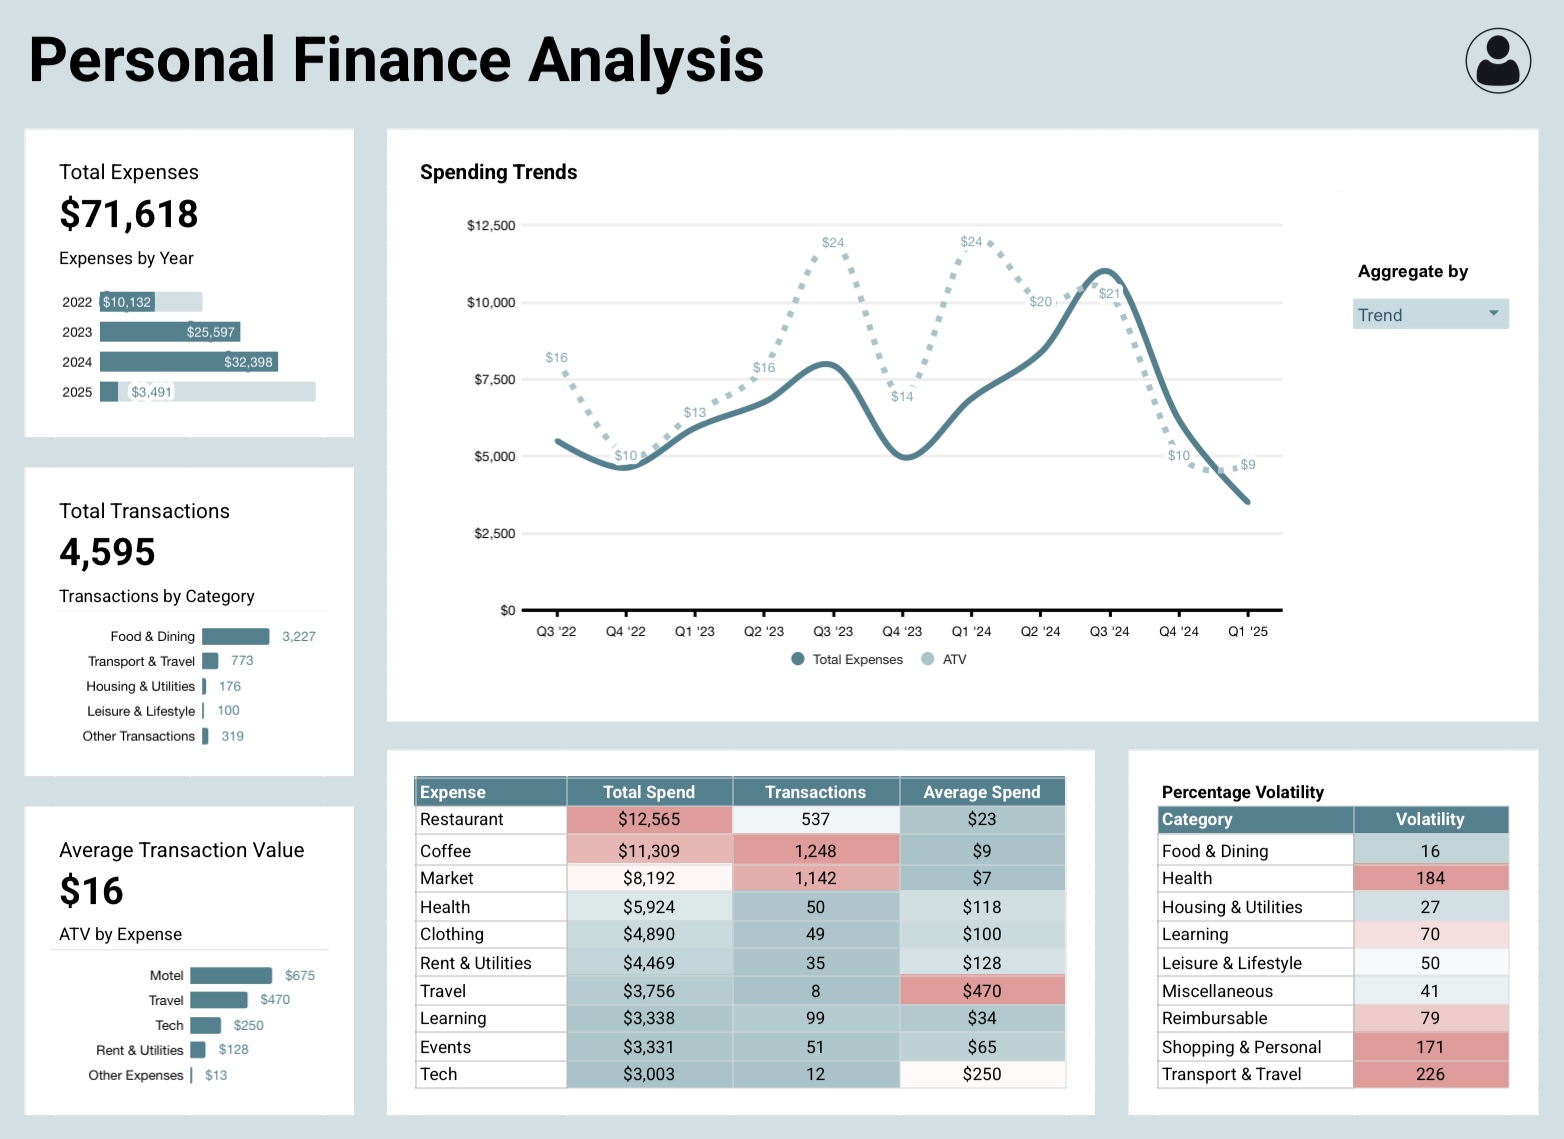
- Total Expenses — $71,618 across 4,595 transactions
- Transactions per Category — e.g., Food & Dining (3,227), Coffee (1,248)
- Average Transaction Value (ATV) — $16 overall
- Category Volatility — stability of spending per category
- Quarterly / Annual Expense Trends — spending peaks and dips
Insights
Some key findings from the dashboard:
- Food & Dining dominates with ~70% of all transactions; average spend per transaction is modest ($23).
- Coffee alone made up 16% of all transactions (frequency-driven spending).
- Large, infrequent purchases in Travel ($470 avg) and Tech ($250 avg) drive major spikes.
- Volatility Analysis:
- High Volatility: Transport & Travel (226%), Health (184%), Shopping & Personal (171%).
- Moderate Volatility: Leisure & Lifestyle (50%), Learning (70%), Reimbursable (79%).
- Low Volatility: Food & Dining (16%), Housing & Utilities (27%).
- Yearly comparison:
- 2023: $25,597. Increase from 2022 estimate.
- 2025 YTD: $3,491. Projected at $39,200.
- Key callouts:
- Spending peaked in Q3 ’24 in a culmination of seasonal spikes, annual increases, and expense volatility.
- Coffee is low-value but high-frequency and adds up significantly.
- Housing & Utilities and Food & Dining, basic human needs, remain stable, predictable categories.
Tools Used
- Google Sheets — data cleaning, pivot tables, calculated fields
- Google Sheets Charts — dashboard visualizations
- Formulas —
SUMIFS,STDEV,AVERAGE,FILTER,FORECAST.LINEAR
Source Data
Personal Budget Transactions Dataset
Next Steps
- Incorporate Income & Savings Rate data for a full financial picture.
- Automate reporting with Looker Studio or Python scripts.