data-analytics-portfolio
⏮️ Back to Portfolio Home; ⬅️ Previous Project; ➡️ Next Project
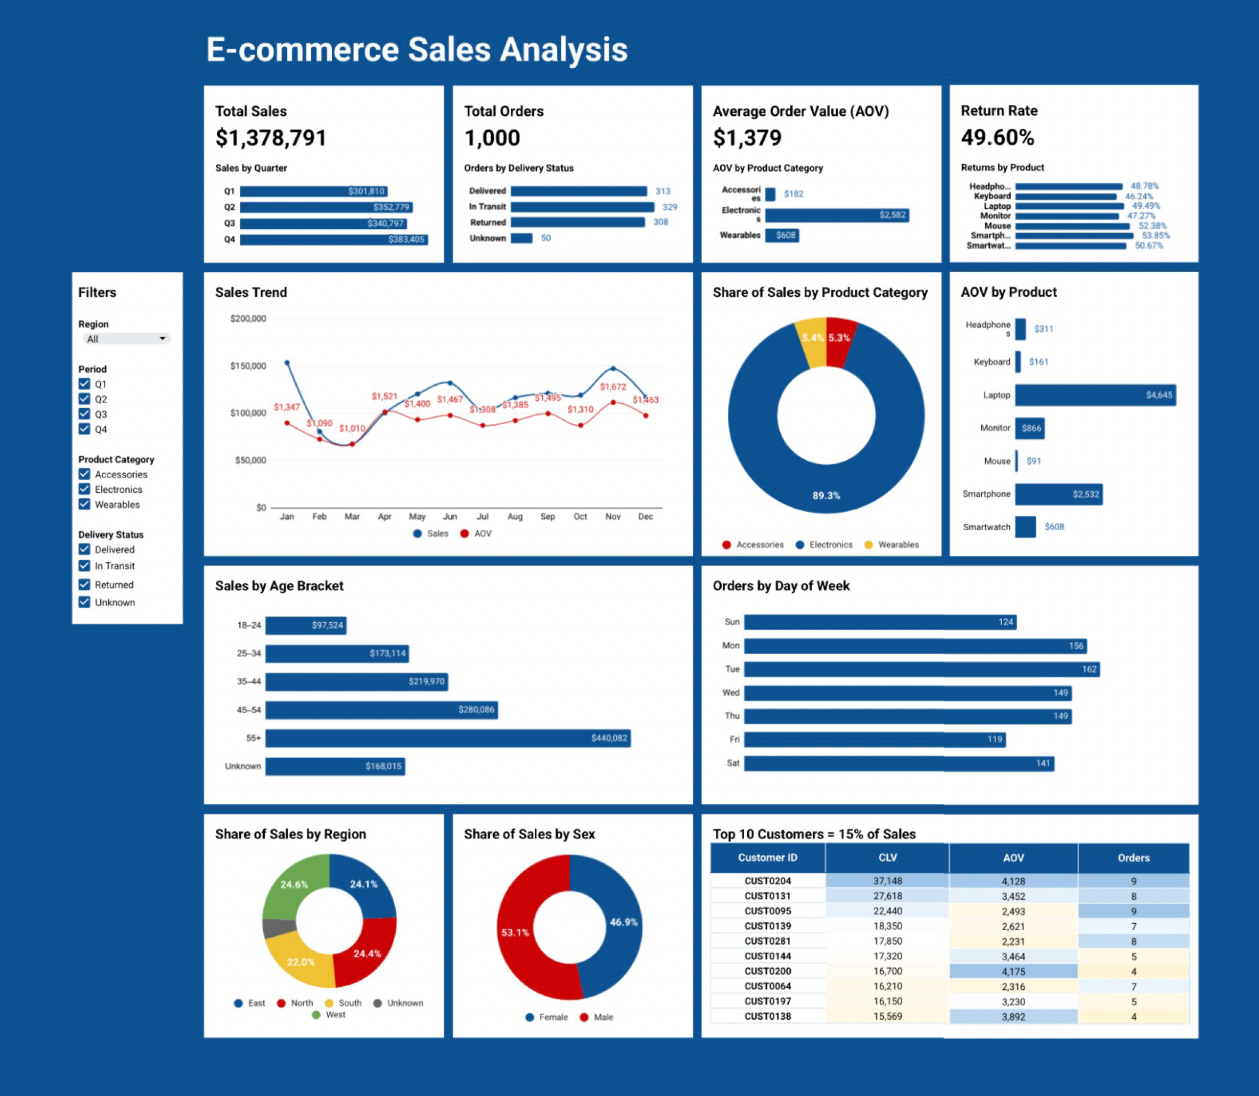
E-commerce Sales Analysis
Project Overview
In today’s fast-paced e-commerce landscape, businesses need clear insights into purchasing behavior and sales trends to stay competitive and maximize revenue.
This project presents a simulated analysis of sales performance for an online store, highlighting top-selling products, high-performing categories, and key customer segments.
With these insights, e-commerce teams can:
- Make data-driven decisions about inventory
- Tailor offerings to the right customers
- Identify opportunities to boost sales and profitability
Dashboard
Interactive Google Sheets:
View the live Google Sheet dashboard here:
View-only Dashboard in Google Sheets
Make a copy to interact with filters
Features:
- Total Sales, Total Orders, Average Order Value (AOV), Return Rate
- Sales breakdown by quarter, region, category, customer demographics
- Trends across time, product categories, age brackets, and shipping status
- Interactive filters for Region, Period (Quarter), Category, and Delivery Status
Data Preparation
A cleaned and transformed dataset was created from raw e-commerce transactions.
- Missing values handled:
- Blank
RegionandShipping Status→ replaced with"Unknown" - Blank
Age→ retained for separate analysis
- Blank
- Derived fields created:
Age BracketDay of WeekMonthQuarter
Key Metrics Tracked
- Customer ID – unique identifier for purchase tracking
- Gender – customer segmentation
- Region – geographical insights
- Age / Age Bracket – demographic segmentation
- Product Name & Category – performance comparisons
- Unit Price & Quantity – revenue calculations
- Total Price – sales revenue per transaction
- Shipping Fee – logistics costs
- Shipping Status – delivery tracking
- Order Date – trend analysis
Insights
Some key findings from the dashboard:
- Q4 generated the highest sales, driven by holiday shopping patterns.
- Electronics dominated sales, accounting for nearly 90% of revenue.
- Return Rate reached ~50%, highlighting an opportunity for quality control and better fulfillment processes.
- Customers aged 35–44 and 45–54 contributed significantly to sales volume.
- Regional distribution showed a balanced split across East, West, and South, with the North slightly lower.
Tools Used
- Google Sheets – data cleaning, pivot tables, calculated fields
- Google Sheets Charts – dashboard visualizations
- Formulas – data transformations (e.g., IF, FILTER, DATE functions)
Source Data
E-commerce Sales and Customer Insights Dataset
Next Steps
- Add advanced analytics such as Customer Lifetime Value (CLV) and Cohort Retention.
- Automate reporting in Looker Studio for dynamic dashboards.
- Integrate with SQL for scalable analysis.