data-analytics-portfolio
⏮️ Back to Portfolio Home; ➡️ Next Project
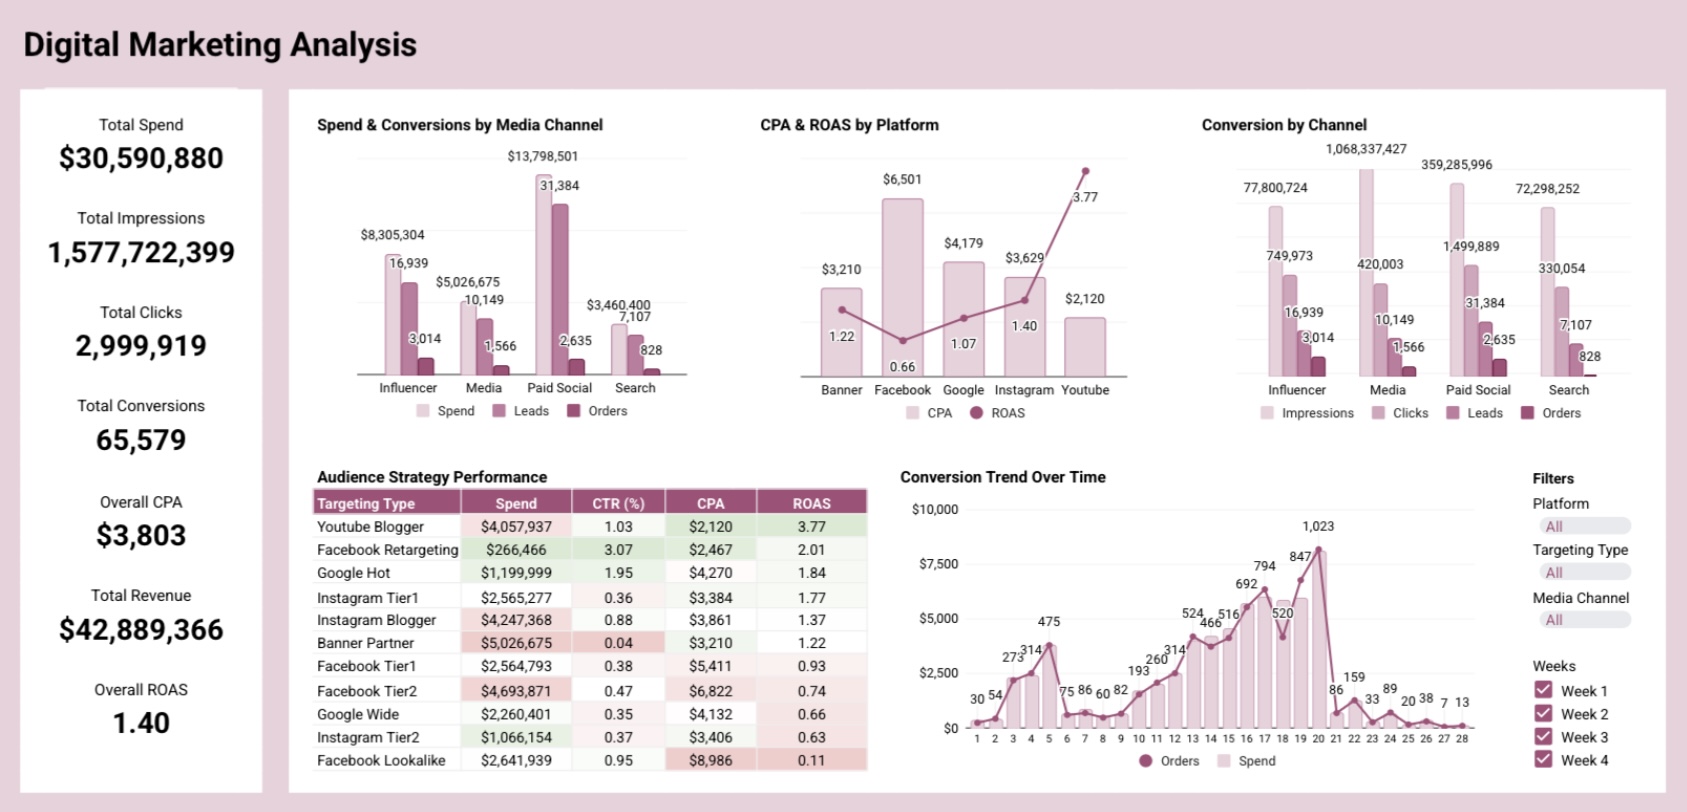
Digital Marketing Analysis
Project Overview
Digital marketing campaigns generate huge volumes of data across channels, platforms, and strategies. This project presents an analysis of digital marketing campaigns, focusing on ROAS (Return on Ad Spend), CPA (Cost per Order), conversion efficiency, and audience targeting.
With these insights, marketing teams can:
- Optimize ad spend allocation across channels
- Improve conversion rates and reduce wasted spend
- Identify high-performing targeting strategies
- Make data-driven decisions for budget planning
Dashboard
Interactive Google Sheets:
View the live Google Sheet dashboard here:
View-only Dashboard in Google Sheets
Create a copy to interact with filters
Features:
- Built with Google Sheets
- Spend & Conversions by Media Channel (Influencer, Media, Paid Social, Search)
- CPA & ROAS by Platform (Banner, Facebook, Google, Instagram, YouTube)
- Conversion Breakdown (Impressions → Clicks → Leads → Orders)
- Audience Strategy Performance Table (CTR, CPA, ROAS)
- Conversion Trend Over Time (spend vs. orders)
- Interactive Filters: platform, targeting type, media channel, weeks
Data Preparation
A cleaned and transformed dataset was created from a publicly available ad campaign dataset.
- Standardized formats:
- Renamed columns for easy understanding
- Harmonized categories where required
- Derived fields created:
CTR = Clicks ÷ ImpressionsCPA = Spend ÷ Conversions (Orders)ROAS = Revenue ÷ Spend- Funnel metrics for conversion stages
- Derived a
Dayscolumn fromStart Dateto track spend and performance over time - Derived a
Platformcolumn fromTargeting Typeto track performance of ad platforms
Key Metrics Tracked
- Total Spend – $30,590,880
- Total Impressions – 1.57B
- Total Clicks – ~3M
- Total Conversions – 65,579
- Overall CPA – $3,803
- Overall ROAS – 1.40
Insights
Some key findings from the dashboard:
- Media spend dominated at $13.8M, but Influencer campaigns delivered better CPA ($1,220) with higher efficiency.
- YouTube Blogger strategy had the highest ROAS (3.77), showing strong profitability.
- Facebook Lookalike audiences underperformed with ROAS of just 0.11.
- Conversion trends peaked in Week 19 (1,023 orders), aligning with a major campaign push.
- Facebook Retargeting achieved the best CTR (3.07%), though not the highest ROI.
- Instagram Tier 2 strategies struggled with low ROAS (<0.7).
Tools Used
- Google Sheets – data cleaning, transformations, pivot tables, calculated metrics
- Google Sheets Charts – dashboard visualizations
- Functions –
AVERAGE,FILTER,COUNTIF,SORT
Source Data
Digital Marketing Metrics & KPIs to Measure (SQL).
Next Steps
- Expand trend analysis to include time-of-day and day-of-week performance
- Expand to multi-touch attribution models for deeper ROI insights.
- Build predictive models for campaign ROI using Python, R, or SQL